Free Power BI visual
DataLund Task List
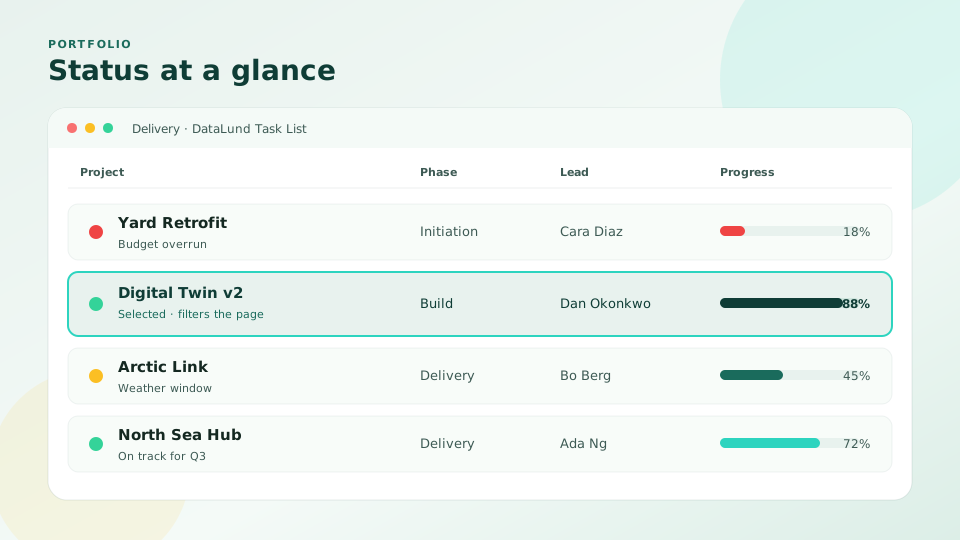
Browse and select projects in Power BI. RAG status, progress, and groups in one scannable list that cross-filters your report.
No network calls — runs in the Power BI sandbox.
Works next to Gantt and
Resource Load on one report page.
Help page for this visual.
For questions, use Support.
Features
- Scannable project / task rows — click to filter the rest of the report
- Optional RAG status chips (Red / Amber / Green; also Rød / Gul / Grønn)
- Progress bar and percent when Progress is bound (0–1 or 0–100)
- Group / phase section headers
- Density presets shared with the suite (Compact / Comfortable / Large / Custom)
- No network calls — runs in the Power BI sandbox
Fields
- Project (required)
- Keep up to date: RAG, Project lead, Progress, Start Date, End Date
- Also supported later: Group (phase sections), Duration, Tooltips
Suite
- Gantt — when tasks run
- Resource Load — who is busy
- Task List — what’s in the portfolio right now