Free Power BI visual
DataLund Resource Load
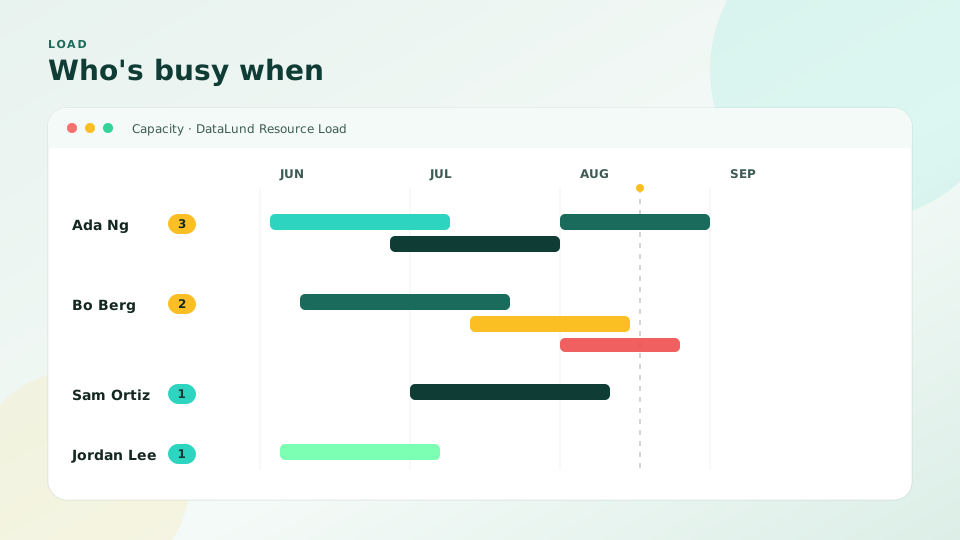
See who is busy when. People (or teams) on tasks over a clear timeline.
No network calls — runs in the Power BI sandbox.
Pair with Gantt for the plan; this visual answers who is loaded.
Help page for this visual.
For questions, use Support.
Features
- One row per person or team
- Assignment bars with optional progress fill
- Overlaps stack in swimlanes inside the resource row
- Load badge shows peak concurrent assignments in the visible window
- Density presets (Compact / Comfortable / Large / Custom) — Format → General
- Format → General → Color by (Single fill / By task / By concurrency)
- Optional time window from today (3 / 6 / 9 / 12 months) — Format → General
- Cross-filter, tooltips, today line, and weekend shading
- No network calls — runs in the Power BI sandbox
Fields
- Resource, Task, Start Date, and End Date (required)
- Optional: Group
- Also supported later: Progress (bar fill), Duration (instead of End Date), Tooltips
Suite
- Gantt — when tasks run
- Resource Load — who is busy
- Task List — what’s in the portfolio right now
How load is shown
Overlapping assignments on the same person stack in small vertical lanes. A numeric badge on the label shows the maximum concurrent count in the visible time window.